The content of this article synthesizes part of the chapter "Concept and brief history of Artificial Intelligence" of the thesis Generation of Artificial [...]
Read More »Clustering methods, or grouping, are a fundamental part of the data analysis process, as they allow an automatic segmentation of the information from which valuable conclusions can be drawn.
Due to their importance, they have been widely studied, hence there are hundreds of algorithms and different ways to classify them.(1). One way would be to divide them into two groups, those that only address the task of grouping, and those that also include certain advantages in the visualization and understanding of the information.
In this article you will understand what clustering is, how it works and how this method can be of great help for the data analysis.
The clustering is a process in which different objects with similar characteristics are grouped into groups called clusters. It is usual not to know the output of the objects to be grouped, so it will be carried out by means of unsupervised training.
This task may seem simple when you have a very small number of characteristics, but the truth is that as you have a larger number of variables, the possible relationships between each object become more complex and difficult to analyze.
It is not a problem with a direct solution, so it requires an iterative process that will vary according to the clustering algorithm.
To group objects together, similar samples must first be found. Measuring this similarity of the samples is done with a similarity function, which is usually a distance function between the feature vectors that make up the sample.
Once the similarity measure is established, the process of clustering depends on the type of algorithm. The most common ones are classified into hierarchical, centroid-based, distribution-based and density-based clustering.
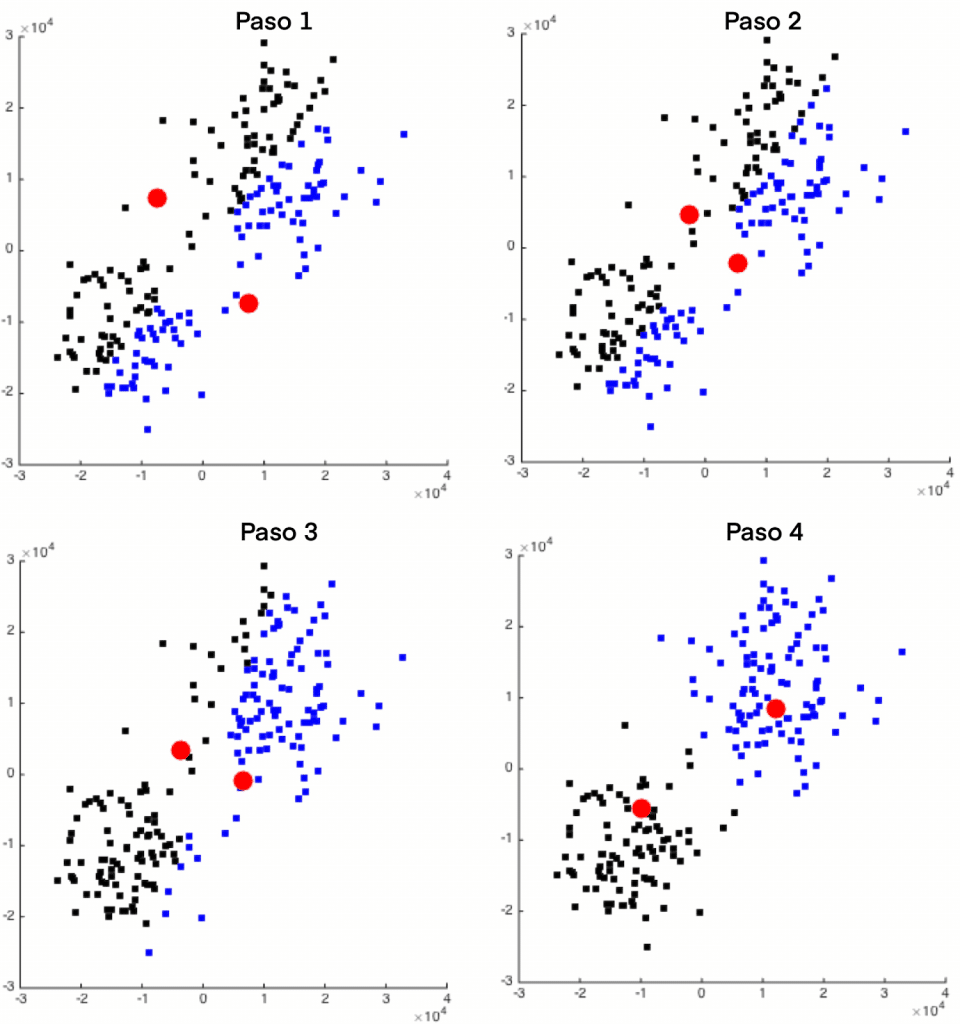
One of the best-known algorithms is that of k-meansbased on centroid. The operation is simple, each cluster will be defined with a prototype object that may or may not be a member of the data set, and will be the centroid of the group. Once the number of clusters is defined, the problem is to find these centroids such that the square of the distances from the group to the prototype object are minimized. An iterative process is carried out where samples are assigned to the clusters and the centroids are updated until the assignments stop changing.
Two types of utilities that can be given to the grouping of the data samples can be highlighted:
Focusing on this first utility, cluster analysis can be performed through segmentation. But there are also clustering methods that provide a number of additional advantages to extract even more information from the data.
These methods can make it possible to visualize high-dimensional data in low-dimensional (typically 2D) maps by performing a smooth, nonlinear mapping of both spaces. This property is known as dimensionality reduction and allows preserving information about the distribution of the input data and observing the relationships of variables in different maps.
In this way, different samples can be compared and moved on these maps to observe the smooth change in their characteristics.
This feature of some clustering methods is very important in most clustering applications and leads to a deeper and easier to understand analysis of the data.
This is best seen with an example. In the following image you can see how these 2D maps look like once the information has been organized with the clustering algorithm. Where each cell characterizes the group of individuals that fall into it and their variables are represented through the different maps.
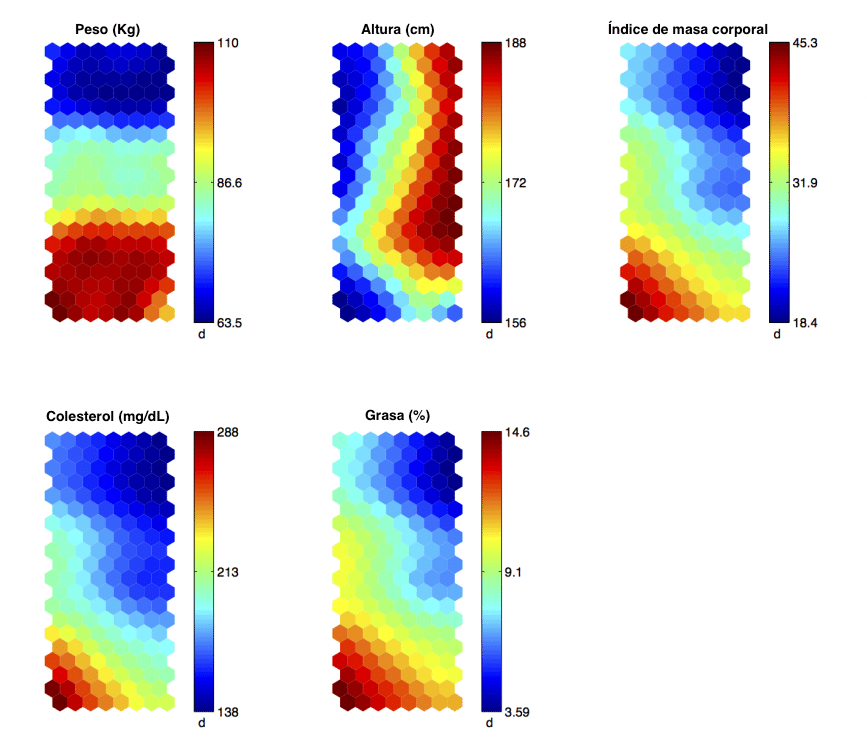
These maps show medical variables such as weight, height, body mass index, cholesterol and fat percentage.
Thus, once the algorithm has been applied, conclusions can be drawn such as that individuals with a high weight (more than 100 kg), short stature (less than 162 cm) have a body mass index, a high cholesterol level and a high percentage of fat, so they could be considered as a high risk group.
This is a very small example, in a real case it would be possible to know the medical history of the patients and a greater number of variables to obtain better and more valuable conclusions.
If, for example, we wanted to know which variables influence the occurrence of an infarction, we could add variables such as the number of infarctions suffered or the type of infarction. Applying the clustering algorithm would help to find different groups of individuals and the characteristics that differentiate them.
Not only that, knowing which are the variables on which we can act, known as levers, thanks to the maps we could know what value they should have to move the behavior to where we want. Knowing also how the rest of the variables would be changed.
Other analyses that these maps allow would be to know the variables that differ the most or are most similar in close groups, seeing their gradual change.
The segmentation of samples according to their properties can be used in any application where you want to relate unclassified samples or want to analyze unstructured data in depth. Some of the applications include:
_
The content of this article synthesizes part of the chapter "Concept and brief history of Artificial Intelligence" of the thesis Generation of Artificial [...]
Read More »You now have everything you need to get down to work and start working with your company's data. After overcoming the first few hurdles of the [...]
Read More »Software as a Service (SaaS) companies have gained enormous prominence in the last few years, mainly due to the novelty of the products [...]
Read More »Artificial intelligence is increasingly used and applied in many sectors, and as it could not be less, it has entered with force in the field of [...]
Read More »